April 2026
Near-Miss Stories
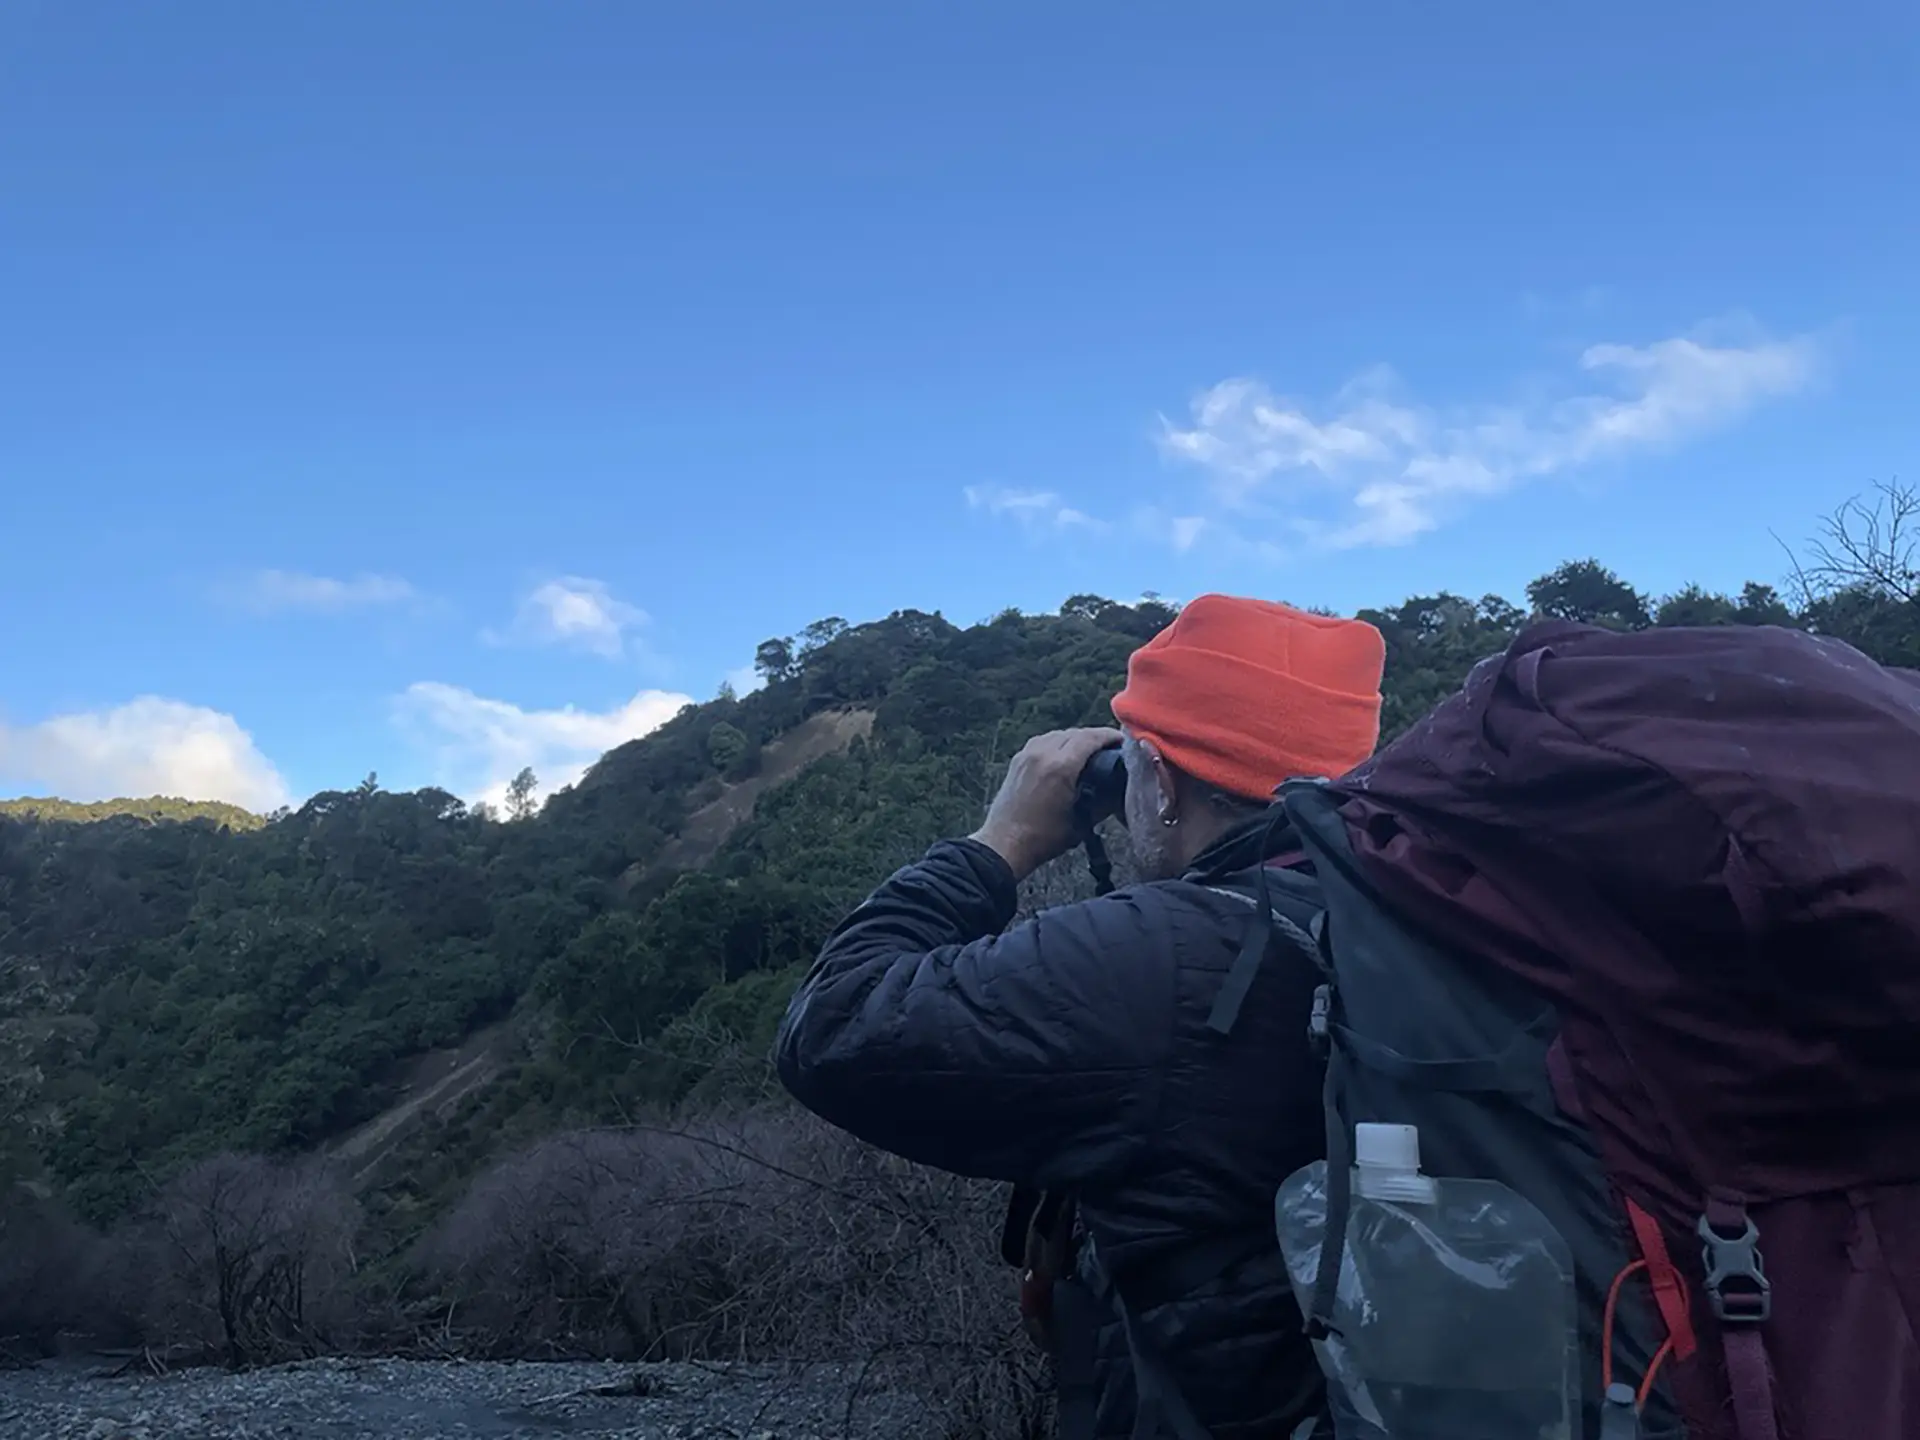
We all have stories of a near miss, incident or accident in the outdoors – an unexpected night out, a forgotten piece of gear that had repercussions, a slip that could have been much worse. These experiences may have shaped how you prepare or helped you make better decisions in the outdoors. Sharing them can help others do the same. This survey gave people the opportunity to share their experience.
Participation
- 337 responses
- 5% of the Adventure Voice research community
Core Findings
Top 5 activities where participants experienced a near-miss
- Overnight/multiday tramp | 50%
- Short walk/day walk | 17%
- Hunting | 10%
- Mountaineering | 5%
- Trail running | 3%
Experience level of participants at the time of the near-miss
- Beginner | 9%
- Intermediate | 44%
- Advanced | 40%
- Expert | 7%
Factors attributed to the near-miss
- Poor decision-making (e.g., group separated) | 34%
- Weather conditions | 31%
- Track conditions (e.g., windfall, damage, rockfall) | 28%
- Insufficient planning | 23%
- Lack of equipment (e.g., shelter, torch, map, crampons) | 22%
- Inexperience/lack of skills | 20%
- Medical event or injury | 19%
- Navigation error (e.g., lost, wrong turn, bluffed/stuck) | 15%
- Insufficient time allowed | 10%
- River crossing (e.g., swept off feet, unable to cross) | 9%
- Insufficient fitness | 8%
- Equipment or gear failure | 6%
- Avalanche | 1%
Common factors that prevented a worse outcome
- Luck and favourable conditions, e.g., good weather windows arriving at the right time, lower river levels or calmer conditions, avoiding injury “by chance”, landing safely during falls, being found quickly
- Outdoors experience and training, e.g., river crossing training, avalanche or alpine skills, navigation experience, previous tramping/mountaineering knowledge, staying calm because they recognised the situation
- Preparation and equipment, e.g., carrying PLBs or communication devices, appropriate clothing and wet-weather gear, emergency shelter or survival equipment, waterproofing gear, ice axes/crampons, first aid supplies, checking gear beforehand
- Good decision-making, e.g., turned around, delayed travel, waited for conditions to improve
- Travelling with others, e.g., collective decision-making, emotional support, someone able to seek help
- Emergency assistance, e.g., help from rangers, helicopter access, carrying a PLB, cell coverage, nearby huts/other parties
Based on the AI analysis of 324 written responses
What This Tells Us
These stories provide valuable insights into near-miss situations, incidents and accidents in the outdoors. We will use them to help us improve safety messaging, identify risk areas and support our outdoor community to make safer decisions.
February 2026
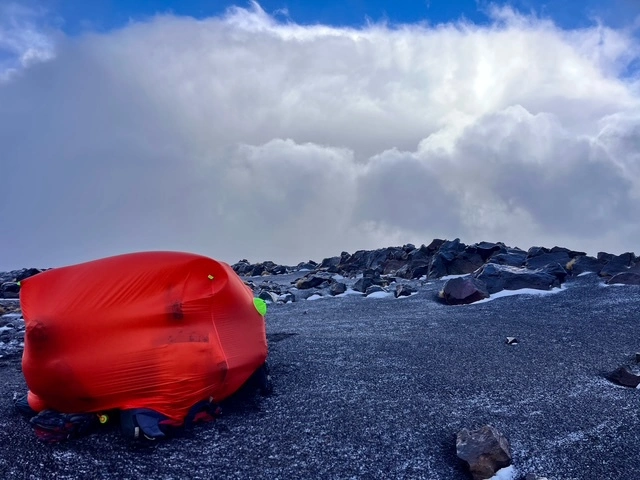
Emergency Shelters
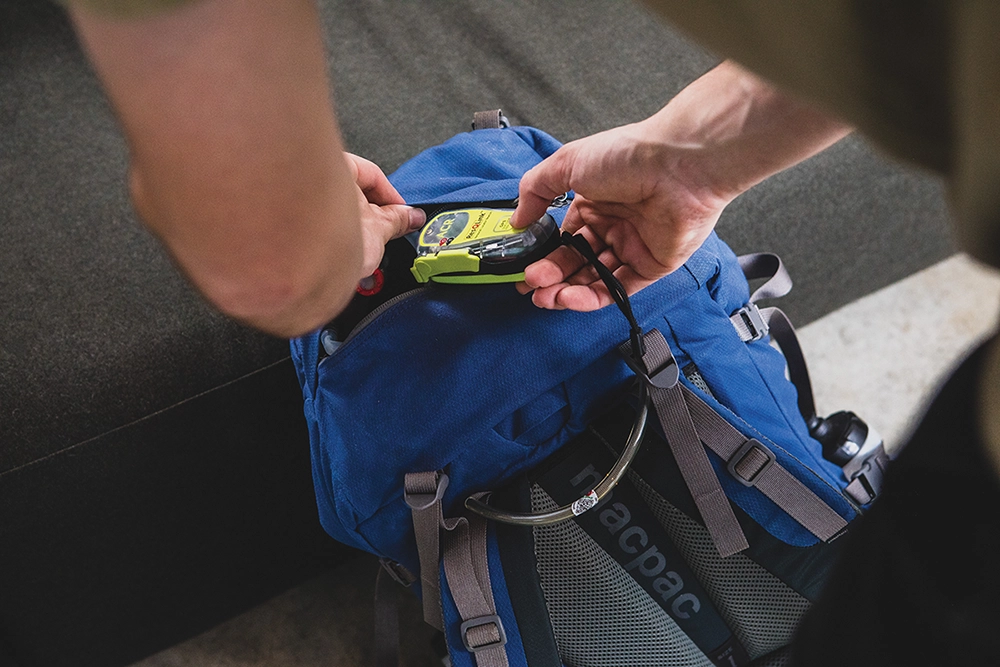
Despite the best planning and preparation, outdoor trips don’t always go as planned. That’s why we recommend carrying an emergency shelter. But despite this advice, we’re aware of incidents where the people involved would have benefited from having an emergency shelter but weren’t carrying one.
We asked our Adventure Voice community to share their thoughts on emergency shelters, including whether they carry one and what influences their decision.
Participation
- 2,227 responses
- 33% of the Adventure Voice research community
Core Findings
Types of emergency shelters
We asked what people consider to be a type of emergency shelter.
Based on 2,227 responses
- Tarp or fly | 75%
- Bivvy bag | 72%
- Tent | 68%
- Emergency thermal blanket | 60%
- Pack liner | 43%
- Bothy bag | 42%
When people take an emergency shelter
Based on 2,227 responses
Day walks of 3 hours or more
- Yes | 52%
- No | 46%
- Don't know | 2%
Overnight/multiday trips
- Yes | 78%
- No | 19%
- Don't know | 4%
Top reasons for not taking shelter
Day walks of 3 hours or more | Based on 1,076 responses
- I thought the trip wasn't long enough to warrant it | 64%
- The weather forecast was fine | 53%
- I didn't think I would need it | 50%
Overnight/multiday trips | Based on 496 responses
- I was planning to stay in a hut | 57%
- I didn't think I would need it | 31%
- I didn't even think about taking one | 27%
Top 5 things people want to know
- Weight/packability | 39.6%
- Types/comparison | 33.1%
- Recommendations | 18.9%
- How and when to use them | 18.5%
- Effectiveness in poor weather | 13%
What this tells us
This survey highlights the gaps outdoor recreationalists have in their knowledge of emergency shelters, and the attitudes and barriers that influence their decision not to carry one. These insights will guide our development of targeted resources to help adventurers know when to take an emergency shelter and what type of shelter is best for their trip, so they go better prepared for the unexpected.
PHOTO CREDIT | Gideon Geerling
November 2025
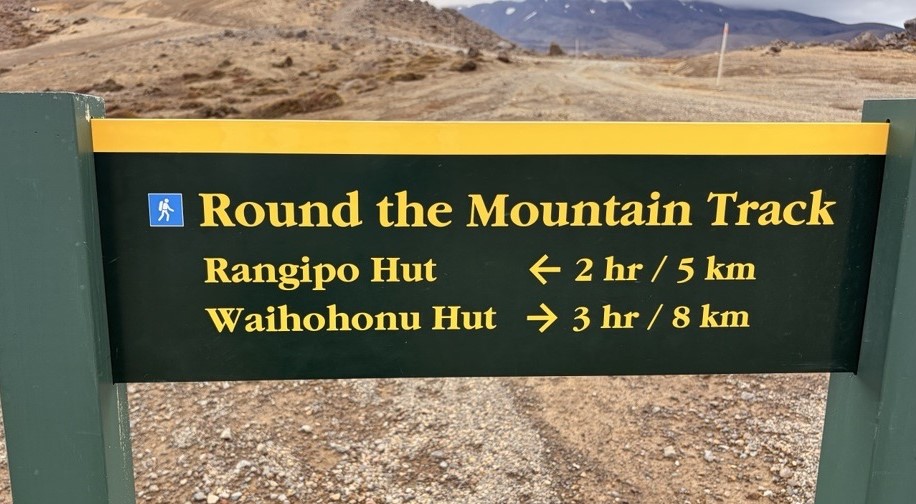
Walking Track Icons
The Department of Conservation (DOC), in collaboration with NZ Mountain Safety Council and other key safety organisations, is redesigning the national walking track icon system. Track icons are used to help hikers and trampers identify a track’s grade (as in the image above). The redesign will help make the icons easier for outdoor adventurers to understand.
To support the redesign project, the November 2025 Adventure Voice survey tested a range of proposed new icons, including different symbols, colours and descriptions.
An impressive 2,155 people – or 35% of the community – answered the survey. This is the highest number of responses for all surveys so far. A big thank you to those who shared their views.
The survey findings have been shared with DOC and will help inform the final outcomes. We look forward to sharing the new designs with you once they have been made public.
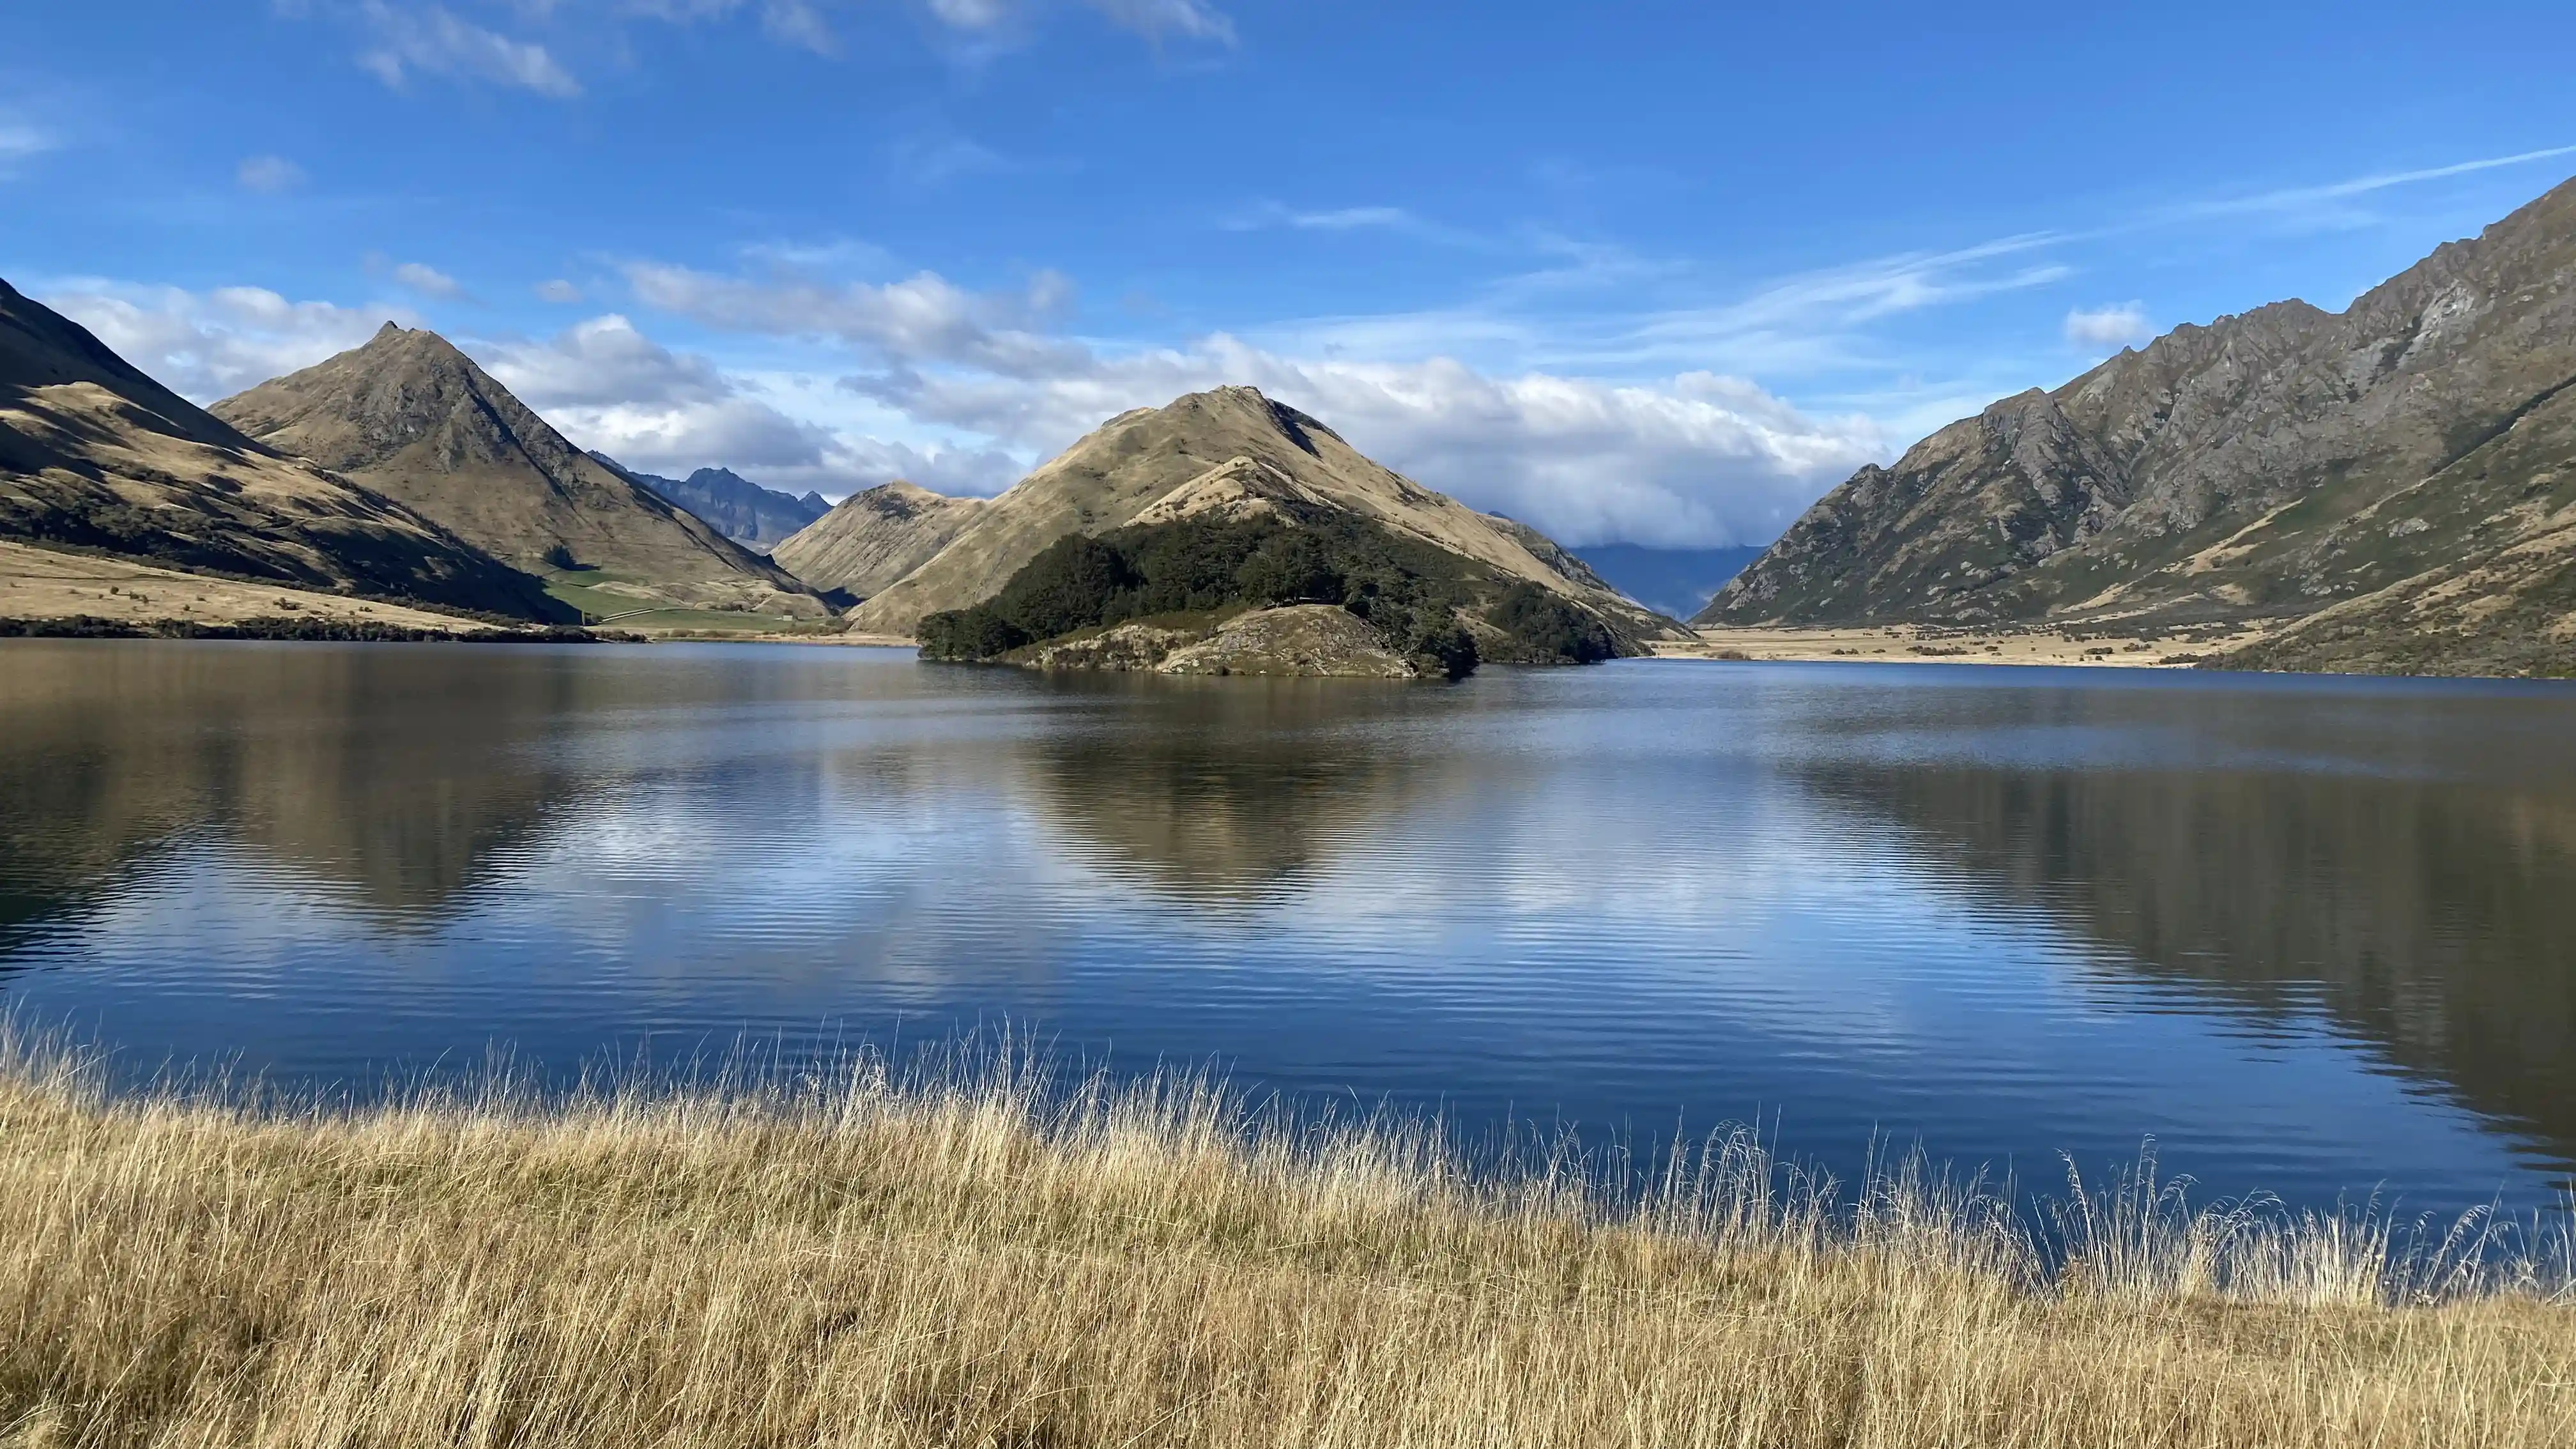
In May, we asked our Adventure Voice research community which navigation tools they use in the outdoors. With a better understanding of the tools people are using, we can create and deliver content that helps outdoor participants identify potential pitfalls with their tool of choice, and mitigate these with quality preparation and planning. 91% of 771 survey respondents said they use a mapping app on their phones to help with navigation. 72% of 771 survey respondents said they also used a printed map to help with navigation. We received over 700 responses, showing that phone apps are edging out the traditional map and compass for navigation. These results indicate a need for safety advice around protecting phones from damage, monitoring the battery and always having a backup. Of the 771 respondents, 91% use a mapping app always (34%) or sometimes (57%), as opposed to 72% that either always (33%), sometimes (39%) or seldom (14%) take a map. Asked how frequently they carry a compass, 26% of respondents said never, while 59% said always (35%) or sometimes (24%). Read our media release on this survey here. Our August Adventure Voice survey investigated how many respondents had changed their plans during an outdoor adventure and the factors leading to this decision. We set out to prioritise areas for enhanced safety messaging and identify education opportunities to help outdoor participants effectively monitor conditions on the go, and confidently make decisions around changing plans. 92% of 882 respondents said yes, they have changed their plans while on an outdoor adventure. Of those who said no, 33% of respondents have had an experience where they wished in hindsight they had changed their plans. The two main factors influencing this decision, or leading people to wish they had changed their plans in hindsight, were: Notably, those doing a short walk were much more likely to change their plans due to track or warning signage (11%) than those on other adventures (5%). We were pleased to see that 'changing plans on the go' is a very common occurrence in the outdoors. This survey confirms that at some point, most people will be in a situation where they will need to do this. Being prepared to change plans is essential and we have identified the following safety behaviours to promote: Every year MSC runs a safety campaign for hunters taking part in the Roar. The Roar is a highlight of the hunting calendar, with thousands of hunters heading into the hills for the deer rutting season in March and April. During this period, the number of severe hunting injuries doubles compared to an average month, with 40% of severe injuries to the knee and shoulder. Ahead of this year’s campaign, we surveyed our Adventure Voice hunting community to find out about their experiences of getting hunting fit. These findings have helped us develop our Roar safety campaign for 2025 and improve safety for the wider hunting community. 332 hunters hunters in our Adventure Voice research community answered the survey. 1 in 7 said they had suffered an injury due to lack of fitness or fatigue 83% of 332 said being fit has helped them have a more enjoyable time on a hunt 73% of 332 said being fit has helped them cover more ground or challenging terrain. Through the survey, we also gathered valuable information on the training activities hunters find most effective for preparing for a hunt and how they stick to their training. Things that get in the way of fitness preparation included being time poor due to other commitments (61%) followed by lack of motivation (31%). Changes in technology often result in changes to behaviour. In the outdoors, we have seen this over the past decade with mountain radios being replaced with other emergency communication devices, such as personal locator beacons and satellite messengers. Aotearoa is on the cusp of the next technological change, with telecommunications companies starting to introduce satellite to mobile technology. With this survey we wanted to build an understanding of how this changing technology might affect the emergency communication device people take into the outdoors. We had 1,469 responses to the survey, with people from across the full range of outdoor activities. 96% took a mobile phone 74% took a personal locator beacon (PLB) 22% took a satellite messenger (e.g., Garmin inReach, Spot X, ZOLEO) 3% took a satellite phone 42% would replace the battery 18% would buy a new PLB 35% hadn’t decided 5% would retire the PLB and use a different communication device Of respondents who think they’ll take just a phone when satellite-to-mobile technology becomes widely available, would do so for the following reasons: Do you treat water from huts or natural water sources, like streams, or do you trust it’s safe to drink? We asked the Adventure Voice community about water treatment on their adventures to better understand what people typically do in the outdoors. Based on 1,630 responses Based on 1,066 responses 79% Boiling 49% Filtration system 39% Chemical tablets 7% UV light system 3% Drops We asked the 922 people who do not always treat hut water about what influences their decision. Key factors influencing people’s decision to drink untreated hut water: We asked the 1,096 people who do not always treat water from natural sources about what influences their decision. Key factors influencing people’s decision to drink untreated water from natural sources: Based on 1,544 responses 123 (8%) Have been sick 1,327 (86%) Have never been sick 77 (5%) Don't know The survey provides valuable insights into the different ways people assess the safety of drinking water in the outdoors. With this understanding, we have developed clearer safety information and practical advice to empower people to make informed decisions about the water they drink outdoors, supporting them to stay healthy and have fun on their adventures. To mark one year of Adventure Voice, we asked our research community to share their thoughts on the leading outdoor safety issues in Aotearoa. The response was huge, giving us clear insights into what matters most to our community. The top five safety concerns identified were: The survey highlights key areas where the community believes further outdoor skill development is needed. These insights are invaluable for shaping our resources, education initiatives and campaigns, ensuring we continue to support everyone to have safe and enjoyable adventures. PHOTO CREDIT | Merrick Rennell, Plan My Walk | Moke Lake Loop Track, Queenstown In November 2024, we surveyed the Adventure Voice hunting community to find out about their experiences of getting fit for the Roar. These findings helped us develop our #ROARfit safety campaign for 2025. At the end of the campaign, we wanted to know how well it had been received. To find this out, we conducted a post-campaign effectiveness survey in May 2025, just after the Roar season had finished. Saw the campaign Took action to get fit for the Roar because of the campaign Shared the campaign messages Encouraged others to do fitness preparation because of the campaign Hunters overwhelmingly identified that the primary message of the campaign was the importance of preparation and fitness for hunting, particularly for the Roar, to prevent injuries and accidents, and enhance enjoyment of the hunting experience. The survey helps us evaluate the effectiveness of our #ROARfit campaign so we can continue to make it even better. Through analysis of the data, we can understand how to more effectively engage and motivate hunters, identify the most relevant and compelling safety messages, and determine how to expand our reach with this audience.Ultimately, this helps us enhance safety for the entire hunting community. August 2025 To stay safe in avalanche terrain, it's critical to check the NZ Avalanche Advisory forecast, get proper training and carry essential emergency avalanche gear. In August 2025, we asked Adventure Voice members about their avalanche training and skills. We wanted to understand how people approach avalanche education across a range of winter activities, including backcountry skiing or splitboarding, snowshoeing, mountaineering or alpine climbing, winter tramping and alpine hunting A total of 1,073 Adventure Voice members responded to the survey, representing 18% of the outdoor research community. This response provides valuable insights into avalanche skills and education across key backcountry alpine activities. We asked participants if they had completed formal avalanche skills training courses or if they planned to do so in the future. Based on 1,073 responses: completed training in the last 5 years completed training 6-10 years ago completed training 11 or more years ago have not completed training but plan to in the future have not completed training course and do not plan to in the future We asked participants about their highest level of avalanche training. Based on 390 responses: completed Avalanche Skills Course 1 completed Avalanche Skills Course 2 completed Avalanche Risk Management (ARM) Level 5 completed Avalanche Risk Management (ARM) Level 6 completed another avalanche training course We asked participants about their main reasons for not undertaking avalanche education or training. Based on 683 responses, participants said: Note: Respondents could select multiple barriers, reflecting the complexity of factors limiting participation. The insights gained from the survey provide a clear picture of current avalanche skill levels and the barriers people face in accessing training. These will help us develop tailored avalanche education resources to improve safety across this community. PHOTO CREDIT: Bianca Bratton
May 2024
Investigating Preferred Navigation Tools in New Zealand's Outdoors
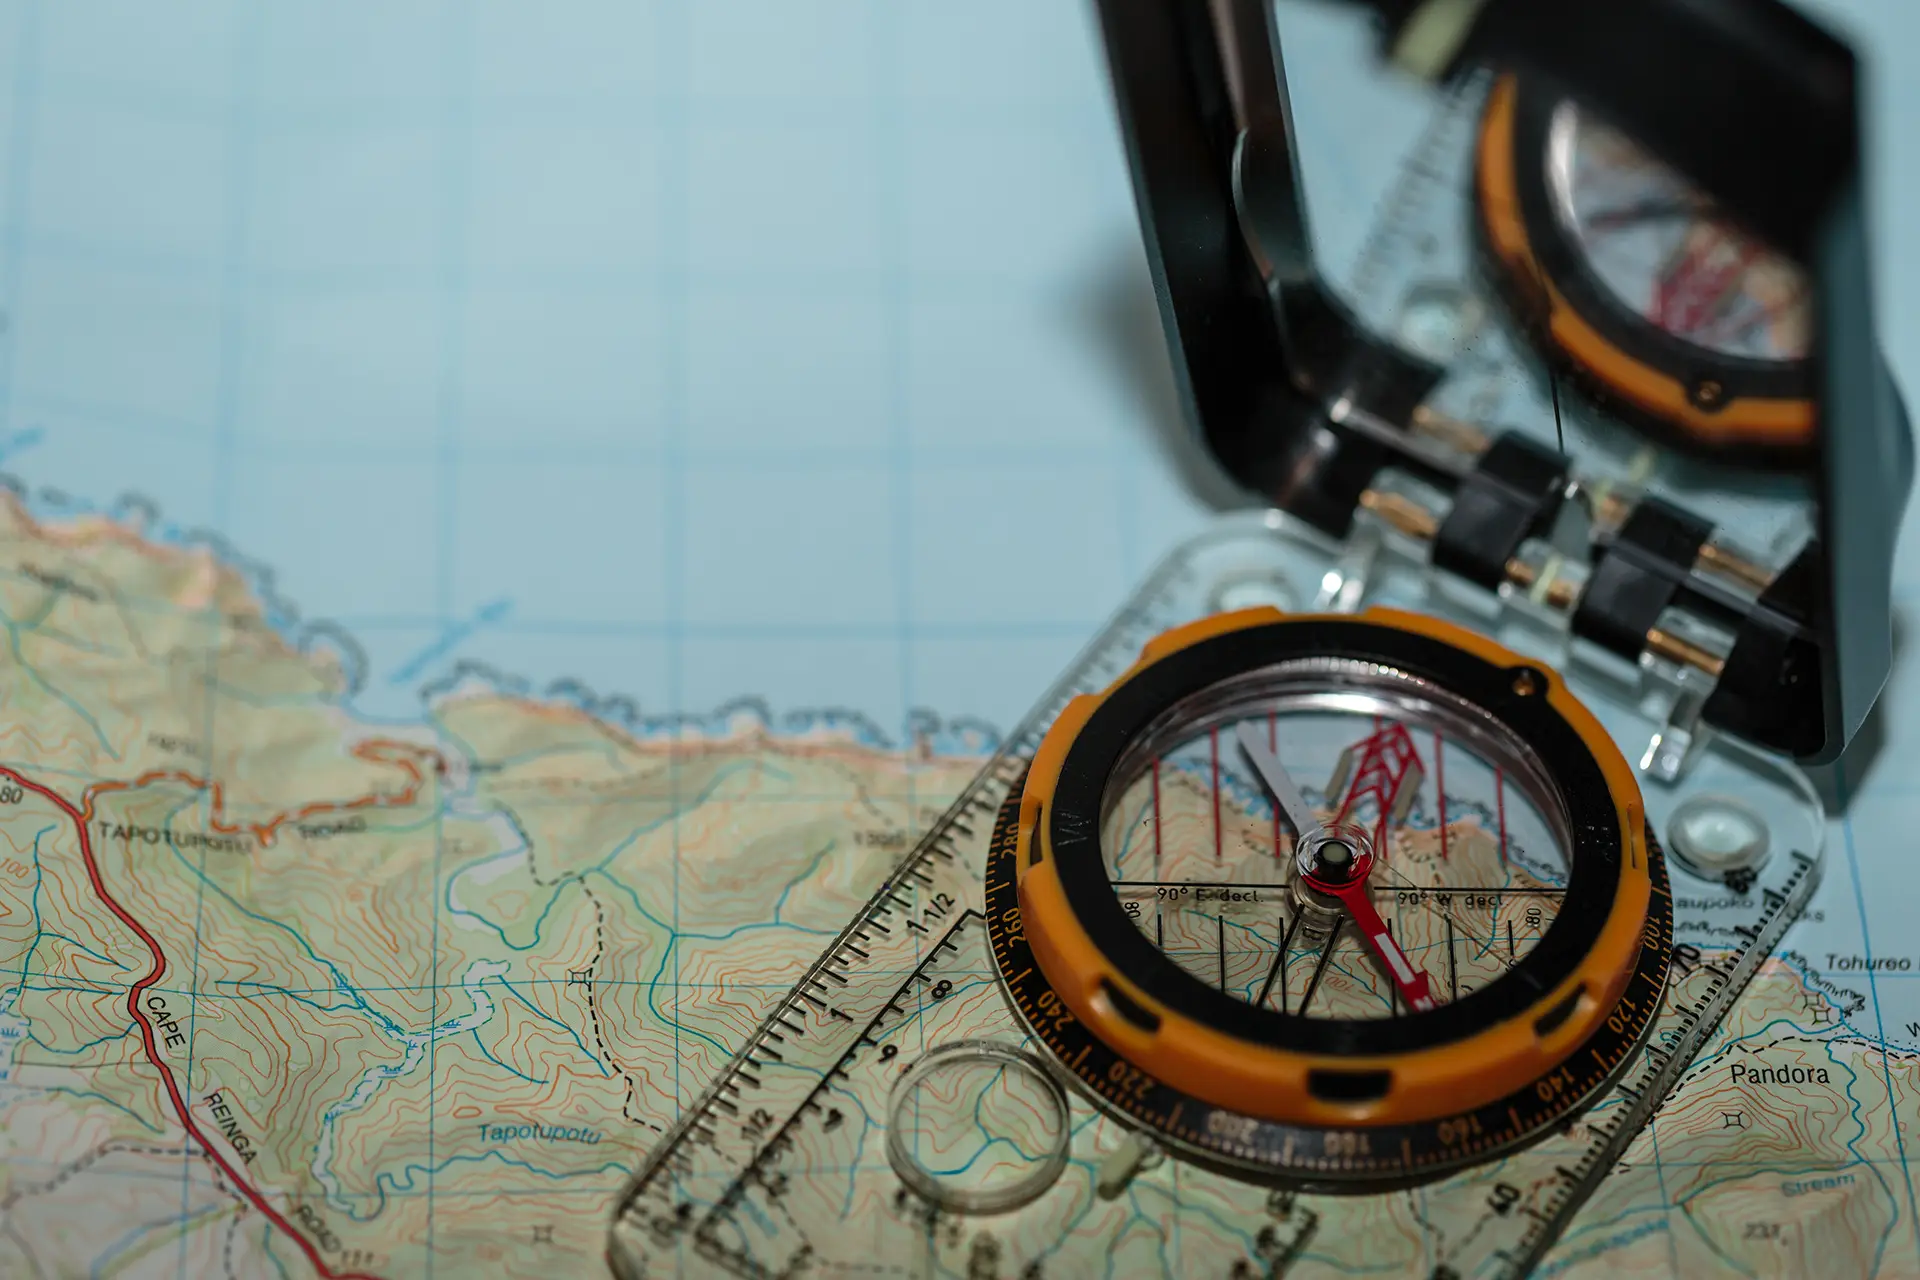
Core findings
What this tells us
August 2024
Adapting on the Track: How Common is it to Change Plans in the Outdoors?
Core findings
Key factors prompting plan changes: poor weather and underestimating track duration
November 2024
How Hunters Get Fit for the Roar
Core findings
Top Tips for Getting Fit for the Roar
Top four preferred training activities:
Top tips for sticking to fitness training:
February 2025
Satellite to Mobile: The Future of Emergency Communications
Core findings
We asked what emergency communication devices people took on their outdoor trips in the past year.
When asked what people would do when their PLB expires,
Key reasons for taking a phone
March 2025
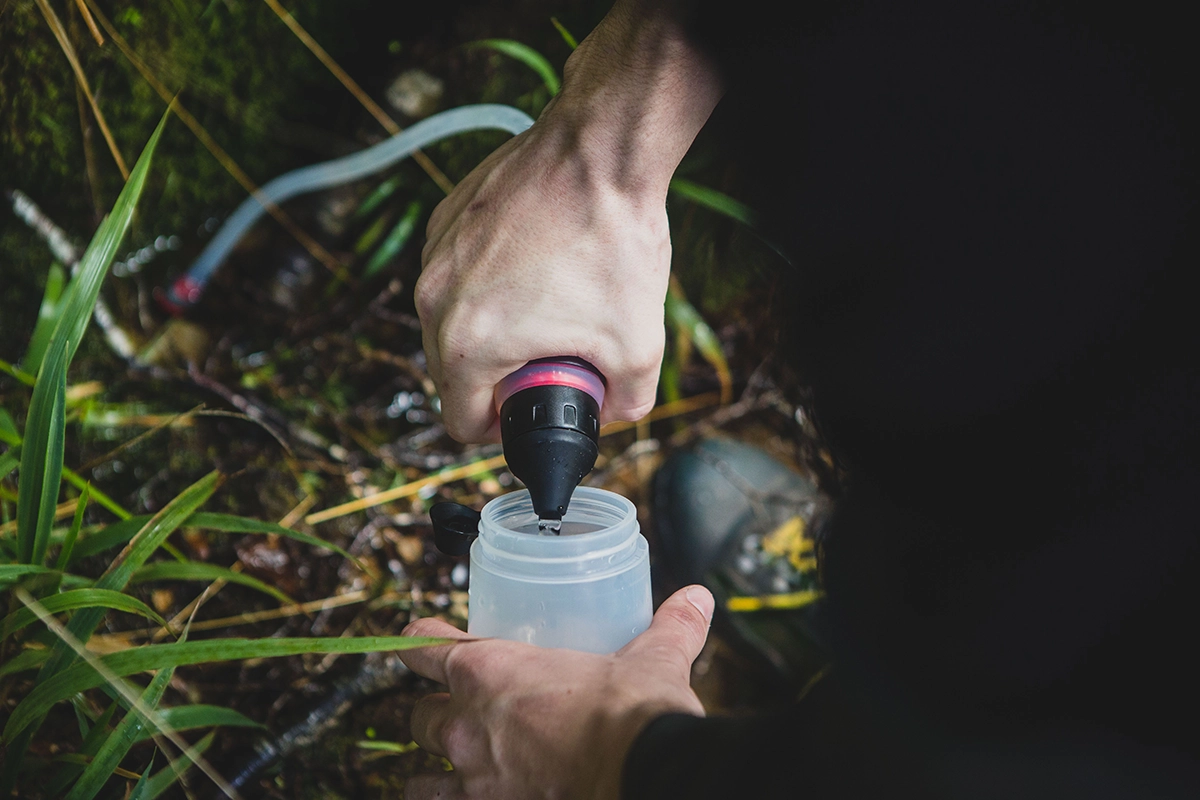
Drinking Water in the Outdoors: To Treat or Not to Treat?
Core findings
Water treatment habits
Most popular water treatment methods
How do people decide if hut water is safe to drink?
How do people decide if natural water sources are safe to drink?
How many people have become sick after drinking untreated water?
What this tells us
 June 2025
Leading Outdoor Safety Concerns in Aotearoa
Participation
Core findings
What this tells us
May 2025
#ROARfit Campaign 2025 – How It Made an Impact
Participation
Core findings
Campaign effectiveness
63%
Behavioural impact
47%
Community engagement
39%
34%
Message effectiveness
What this tells us
Avalanche Education in Aotearoa: Participation, Skills and Barriers
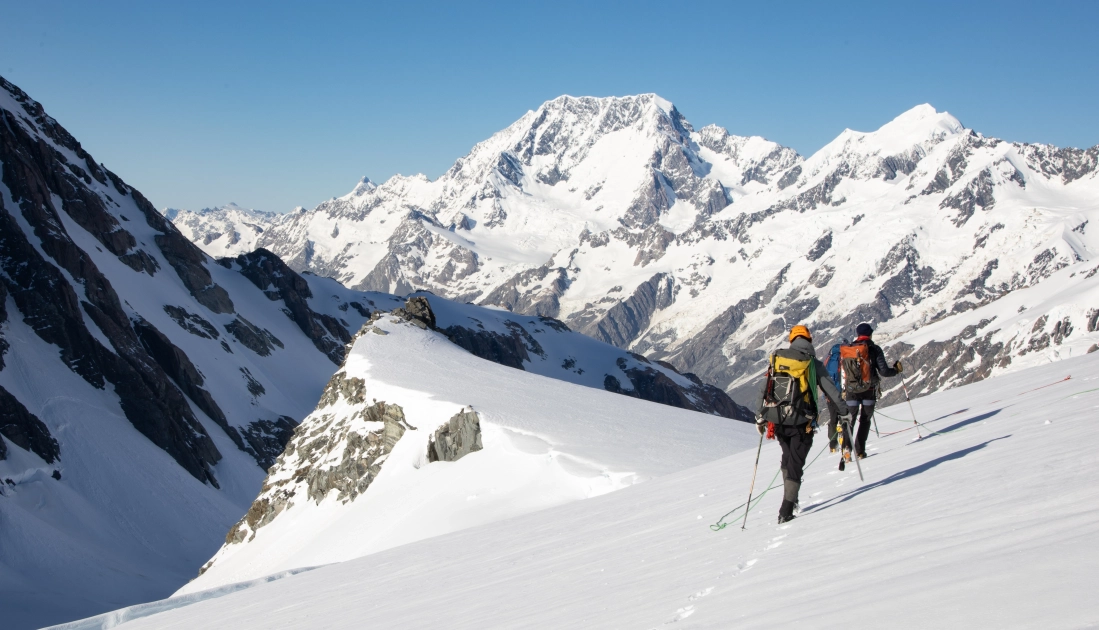
Participation
Core Findings
Avalanche training
18% (189 people)
5% (53 people)
14% (148 people)
28% (299 people)
36% (384 people)
Skill levels
57% (224 people)
14% (53 people)
11% (44 people)
4% (14 people)
14% (55 people)
Barriers to avalanche education
What This Tells Us